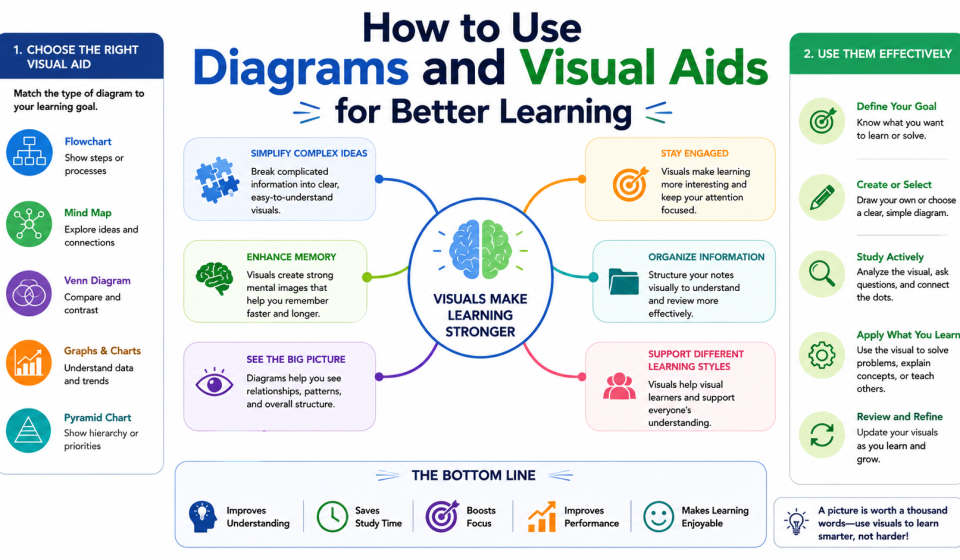

Learn how to use diagrams and visual aids for better learning. Discover practical techniques, benefits, and real-life examples that help students improve understanding, memory retention, and academic performance.
Have you ever read a chapter multiple times but still struggled to remember the information? Many students face this challenge, especially when studying complex subjects. The good news is that there is a simple and effective solution: diagrams and visual aids.
Visual learning techniques have become increasingly popular because they help learners understand and remember information more effectively. Instead of relying only on text, diagrams transform concepts into visual representations that the brain can process faster. From school classrooms to corporate training programs, visual aids are widely used to make learning easier and more engaging.
Whether you are preparing for board exams, college entrance tests, competitive exams, or professional certifications, learning how to use diagrams and visual aids can significantly improve your study experience and results.
What Are Diagrams and Visual Aids?
Diagrams and visual aids are graphical tools used to present information visually. They simplify complex concepts and make it easier to understand relationships, processes, and structures.
Common examples include:
- Mind Maps
- Flowcharts
- Concept Maps
- Timelines
- Graphs and Charts
- Venn Diagrams
- Infographics
- Illustrations and Drawings
These tools help learners organize information in a way that is easier to remember and recall.
Why Visual Learning Works
Research has shown that the human brain processes visual information much faster than text. Visual content captures attention and helps create stronger memory connections.
For example, imagine trying to memorize the water cycle through a paragraph of text. Now compare that with a simple diagram showing evaporation, condensation, precipitation, and collection. Most students will remember the diagram more easily because it presents the information in a structured visual format.
Visual learning works because it:
- Improves understanding
- Increases memory retention
- Enhances concentration
- Simplifies complex topics
- Makes learning more engaging
This is why teachers often use charts, illustrations, and diagrams during lessons.
Benefits of Using Diagrams and Visual Aids
1. Better Understanding of Complex Concepts
Some subjects contain information that is difficult to understand through text alone. Diagrams break down complicated ideas into simpler visual formats.
For instance, biology students often use labeled diagrams to understand the human digestive system. Instead of reading lengthy explanations, they can quickly identify different organs and their functions through a visual representation.
2. Improved Memory Retention
Visual information is generally easier to remember than written text. When learners combine words with images, the brain creates stronger memory associations.
A student preparing for a history exam may use timelines to visualize important events. This method makes it easier to remember dates and sequences compared to reading plain text repeatedly.
3. Faster Revision
Visual aids allow students to review large amounts of information quickly.
Before exams, a mind map summarizing an entire chapter can be revised in minutes. This saves time and reduces stress during preparation.
4. Increased Engagement
Studying from textbooks alone can sometimes feel boring. Visual aids make learning more interactive and enjoyable.
Colorful charts, diagrams, and illustrations help maintain interest and motivation, especially during long study sessions.
5. Better Problem-Solving Skills
Visual representations help learners identify patterns, relationships, and connections between concepts.
For example, flowcharts are commonly used in mathematics and computer science to solve problems step by step.
Types of Visual Aids and Their Uses
Mind Maps
Mind maps are excellent for brainstorming and organizing ideas.
Students can place the main topic at the center and create branches for related concepts. This technique is particularly useful for subjects such as science, literature, and social studies.
Flowcharts
Flowcharts show processes in a step-by-step sequence.
They are useful for understanding procedures, scientific experiments, business workflows, and decision-making processes.
Concept Maps
Concept maps display relationships between different ideas.
These are highly effective for understanding complex subjects where multiple concepts are interconnected.
Timelines
Timelines organize events in chronological order.
History students frequently use timelines to remember important events, dates, and developments.
Graphs and Charts
Graphs and charts simplify numerical information.
They help learners analyze trends, compare data, and understand statistics more effectively.
Venn Diagrams
Venn diagrams compare similarities and differences between concepts.
They are commonly used in literature, science, and social studies.
How to Use Visual Aids Effectively
Match the Diagram to the Topic
Choose the appropriate visual aid based on the information you are studying.
For example:
- Use flowcharts for processes.
- Use timelines for historical events.
- Use mind maps for brainstorming.
- Use graphs for numerical data.
Keep It Simple
Avoid overcrowding diagrams with excessive information.
A clear and organized visual aid is far more effective than a complicated one.
Use Colors Strategically
Colors help highlight important information and improve organization.
For example, different colors can represent different categories, topics, or levels of importance.
Add Keywords Instead of Full Sentences
Use short phrases and keywords rather than lengthy explanations.
This keeps the diagram concise and easy to review.
Update and Revise Regularly
Visual aids should evolve as your understanding grows.
Review and update your diagrams periodically to reinforce learning.
Real-Life Example of Visual Learning
Consider the case of Rohan, a college student preparing for competitive exams. Initially, he relied solely on textbooks and struggled to remember important concepts.
After switching to visual learning techniques, he started creating mind maps for current affairs, flowcharts for science topics, and timelines for history. Within a few months, he noticed significant improvements in memory retention and exam performance.
His experience highlights how visual aids can transform the learning process when used consistently.
Digital Tools for Creating Visual Aids
Today, learners have access to many digital tools that simplify diagram creation.
Popular options include:
- Canva
- Lucidchart
- Microsoft PowerPoint
- Google Drawings
- Miro
- MindMeister
These tools allow users to create professional-looking diagrams quickly and efficiently.
Common Mistakes to Avoid
While visual aids are highly effective, certain mistakes can reduce their usefulness.
Avoid:
- Overloading diagrams with information
- Using too many colors unnecessarily
- Creating unclear connections
- Copying diagrams without understanding them
- Ignoring regular revision
The goal is to make learning simpler, not more complicated.
Conclusion
Diagrams and visual aids are powerful learning tools that make complex information easier to understand and remember. Whether you’re a school student preparing for exams, a college student studying advanced subjects, or a professional learning new skills, visual learning techniques can significantly improve your comprehension and retention. Mind maps, flowcharts, infographics, concept maps, and illustrations help organize information in a structured manner, making it easier for the brain to process and recall later.
In today’s digital age, creating visual aids has become easier than ever with online tools and educational platforms. By combining visual learning with active reading, note-taking, and regular revision, learners can achieve better academic results and gain a deeper understanding of their subjects. The key is to choose the right type of visual aid for the topic being studied and use it consistently as part of your learning routine.
Frequently Asked Questions (FAQs)
1. Why are diagrams effective for learning?
Diagrams simplify complex concepts into visual formats, helping the brain process and remember information more efficiently than text alone.
2. Which types of diagrams are best for studying?
Mind maps, flowcharts, concept maps, Venn diagrams, timelines, and infographics are among the most effective visual learning tools.
3. Can visual aids improve exam performance?
Yes. Visual aids help improve memory retention, understanding, and revision efficiency, which can lead to better exam performance.
4. Are visual aids useful for all age groups?
Absolutely. From school students to working professionals, visual learning techniques can benefit learners of all ages.
5. How can I create my own visual aids?
You can create visual aids using pen and paper or digital tools such as Canva, Lucidchart, Microsoft PowerPoint, and Google Drawings.